Bacteria are present throughout an aerated stabilization basin (ASB), though their form and concentration may differ in the different areas of the ASB. At the front end of the ASB, where the influent enters and there is the highest concentration of biochemical oxygen demand (BOD), bacterial concentrations are higher and bacteria are dispersed as they are busy consuming the BOD. At the back end of the system, where BOD is sparse, bacteria form floc and settle out. The bacterial growth curve, as seen in Figure 1, characterizes the different growth stages of bacteria in relation to the amount of food (BOD) available.
 bbbbbbbbbbbbbbbbbbbbbbbbbbbbbbbFigure 1: The Bacterial Growth Curve
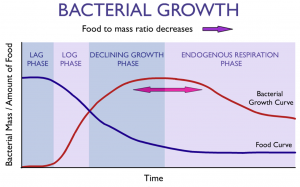
The growth rate of the bacteria in the ASB is directly proportional to the amount of BOD available. Figure 1 shows the growth rate of the bacteria over time. The blue curve represents the amount of BOD available for consumption. The red curve represents the amount of bacterial mass in the bulk water. There are four distinct phases of bacterial growth: lag phase, log phase, declining growth phase and endogenous respiration phase.
Lag Phase
During this phase, there is a large amount of food available compared to the amount of bacteria. It is called the “lag phase” because it takes the bacteria a certain amount of time to respond to the available food.
Log Phase
In the log phase, the bacteria have begun consuming the BOD and start replicating exponentially. We can see the red bacterial curve increasing and the blue food curve decreasing in this phase.
Declining Growth Phase
The available food begins to diminish and bacterial reproduction begins to slow, as there is more competition for food. We can see the growth rate slowing on the red bacterial curve. With less food available, bacteria begin to cluster and form floc.
Endogenous Respiration Phase
The majority of the BOD has been converted and there is little food available for the bacteria to consume. Most of the bacteria have formed floc. Some bacterial cells die and lyse open, releasing some BOD and nutrients back into the water. Floc can settle out to the bottom of the ASB, which leaves a clearer effluent with little BOD behind. It is ideal that this phase is reached before the effluent point of the ASB for the highest quality discharge.