Process Chemical Inhibition Assessment
Environmental Business Specialists, LLC (EBS) was contracted to perform an inhibition assessment to determine if a test substance (TS) in the client’s wastewater would cause problems for the local publicly owned treatment works (POTW) that receives the wastewater. The Test Substance was an organic solvent produced by the client for sale.
Executive Summary
- Based on respirometric data along with initial and final physicochemical testing, the test substance is inhibitory to this POTW biomass and high concentrations of it could lead to problems for the POTW. The inhibition caused by doses 1, 10, and 100 ppm was brief and did not lead to notable differences in cumulative oxygen uptake, while the inhibition caused by does 1,000 and 5,000 ppm caused severe, prolonged inhibition.
- There is some evidence that acclimation to the test substance is possible for the biomass, but acclimation testing was outside of the scope of this study, and more testing would be necessary to confirm this.
- The bottles had a progressively lower maximum oxygen uptake rate as the Test Substance concentration got higher. Doses of 1, 10, 100, 1,000, and 5,000 ppm showed reductions to the maximum oxygen uptake rate of 43.4%, 52.3%, 58.6%, 81.8%, and 96.0%, respectively, compared to the substrate control. This indicates that the biomass will consume BOD at a slower rate when in the presence of Test Substance.
- The bottles with 1,000 ppm of Test Substance or higher had an average maximum oxygen uptake rate that was lower than the seed control bottles, indicating that the biomass in contact with these high concentrations of the process chemical experienced severe inhibition.
- The bottles with 1,000 ppm of Test Substance or higher also had a lower cumulative oxygen uptake after 23 hours than the other bottles, indicating that treatment in these bottles could not be completed within this time frame. This is confirmed by the final COD data.
Methods
EBS received approximately five gallons of POTW biomass and approximately 250 mL of Test Substance. The biomass arrived in good condition and on ice. Prior to the study, the biomass was aerated overnight to bring the respiration of the bacteria to endogenous. Initial sample characterization was performed on the biomass and process chemical. The biomass was tested for total and volatile suspended solids (TSS/VSS), pH, total chemical oxygen demand (tCOD), total biochemical oxygen demand (tBOD), and chemical constituent composition.
The respirometric inhibition assessment and biodegradability procedures were followed as described in Respirometry for Environmental Science and Engineering (Young and Cowan, 2004). The biomass was added to the reactor bottles to achieve a starting VSS concentration of 1500 mg/L in each bottle. Trace minerals and nutrients were added in the form of Mineral and Nutrient Bases as outlined in the procedure. Bottles were supplemented with ammonium chloride (NH4Cl), if necessary, to achieve at least a 40:1 COD:N ratio. 250 mg of TCMP, a nitrification inhibitor, was added to each bottle to ensure that all oxygen uptake observed was due to carbonaceous bacterial activity. Deionized (DI) water was added to each bottle to bring the total volume to 500 mL.
Results & Discussion
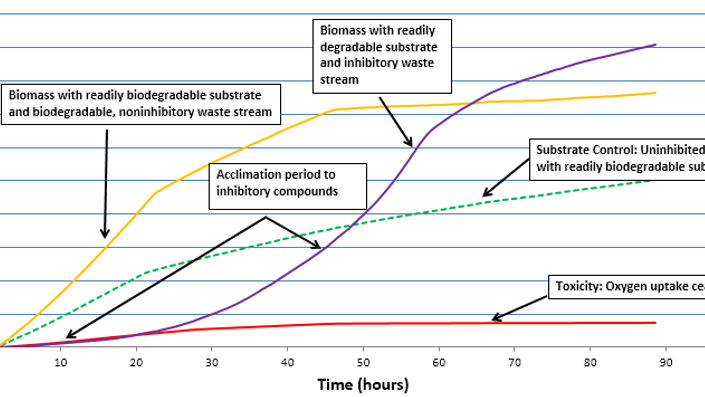
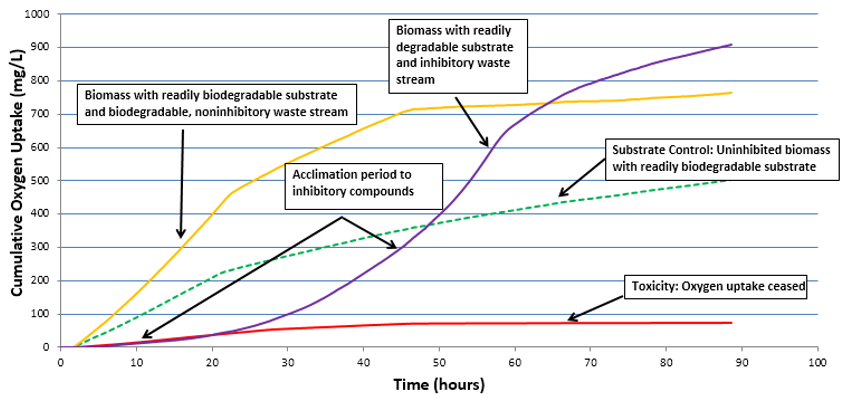
Figure 1 shows example oxygen uptake curves, which provide information about the effects different waste streams can have on biomass. Figure 1 can be used as a reference tool to explain how inhibition and toxicity appear on a cumulative oxygen uptake curve. Inhibitory substances lead to a reduction in the respiration rate of microorganisms, thereby reducing the amount of oxygen consumed per unit of time. Inhibition assessments using respirometry compare the respiration rates of microorganisms consuming an easily degradable food source called a substrate control. Any inhibition caused by a waste stream of interest would result in a reduction of oxygen uptake compared to the substrate control. Waste streams that create curves showing more oxygen uptake than the substrate control indicate no inhibition and a readily biodegradable waste stream. Oxygen uptake curves that begin with less uptake than the substrate control but consume more oxygen than the substrate control over time indicates that the waste stream was inhibitory, but the biomass was able to acclimate over time. Waste streams that show an oxygen uptake curve that registers less uptake than the seed control indicate toxicity or a severe reduction in cellular respiration. When the slopes of the curves decrease and remain consistent over time, it is identified as having reached endogenous respiration. Endogenous respiration occurs when the biomass has broken down all the readily degradable BOD and is utilizing energy reserves to undergo respiration.
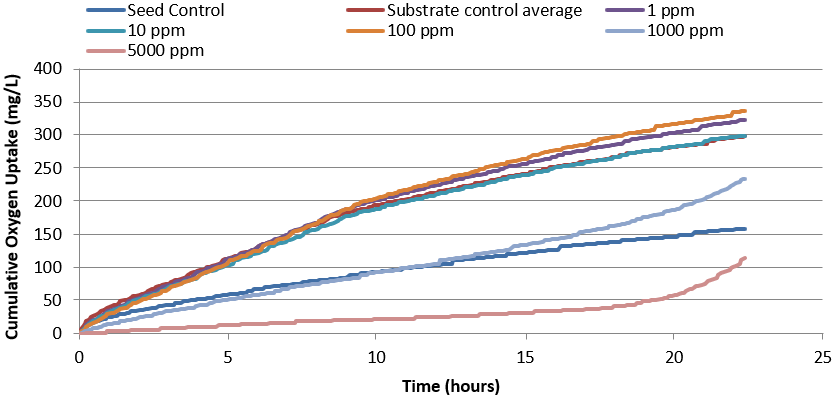
The average cumulative oxygen uptake of each set of bottles is shown in Figure 2. There is a dose-response, where the 5000 ppm Test Substance bottles showed the lowest oxygen uptake, the 1000 ppm bottles showed the next lowest oxygen uptake, and the 100, 10, and 1 ppm showed comparable oxygen uptake with the substrate control. This indicates that the biomass is inhibited by increasing concentrations of the Test Substance. At approximately 18 hours, both the 5000 ppm bottles and the 1000 ppm bottles show an increase in oxygen uptake, which suggests that the biomass was able to adapt or acclimate to the presence of the Test Substance.
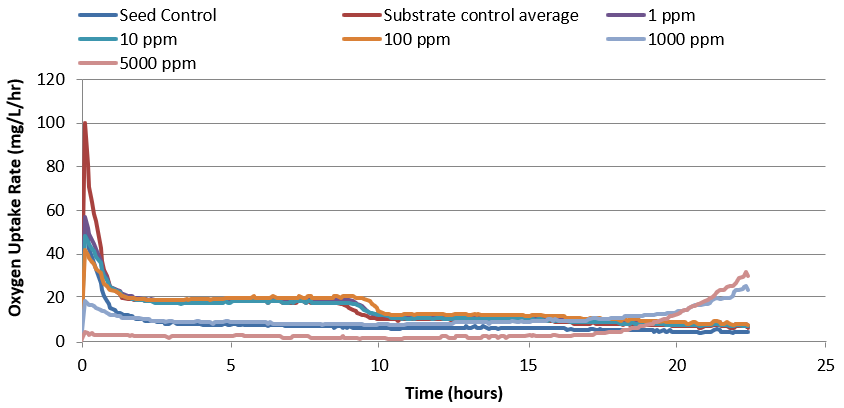
The average oxygen uptake rate of each set of bottles is shown in Figure 3. None of the bottles containing Test Substance achieved a maximum oxygen uptake rate as high as that of the substrate control. This indicates that Test Substance is inhibitory to the biomass. Test Substance doses of 1, 10, 100, 1,000, and 5,000 ppm showed reductions to the maximum oxygen uptake rate of 43.4%, 52.3%, 58.6%, 81.8%, and 96.0%, respectively, compared to the substrate control. This indicates that the biomass will consume BOD at a slower rate when in the presence of Test Substance. These percent reductions are calculated over the first 10 hours of the study since the acetate in all bottles except the 1,000 and 5,000 ppm bottles had been consumed by this time. The 1,000 and 5,000 ppm bottles achieved their actual maximum rate after approximately 18 hours, once the biomass acclimated to Test Substance. The maximum rate of the 1000 ppm and 5000 ppm bottles is also lower than that of the seed control, which indicates that at these high concentrations of Test Substance, the biomass is severely inhibited. Although the 1, 10, and 100 ppm doses show a reduction in maximum oxygen uptake rate compared to the substrate control, they do not ultimately have a notable effect on the cumulative oxygen uptake over the course of the study, as shown in Figure 2. This indicates that these doses of Test Substance are inhibitory to biomass but may not impact the performance of the POTW.
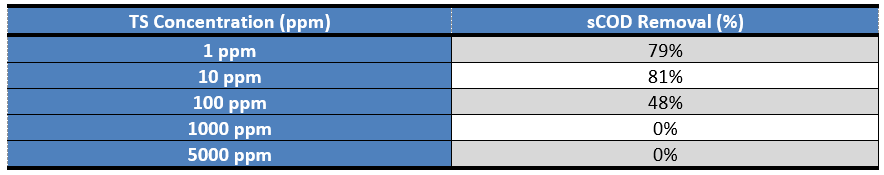
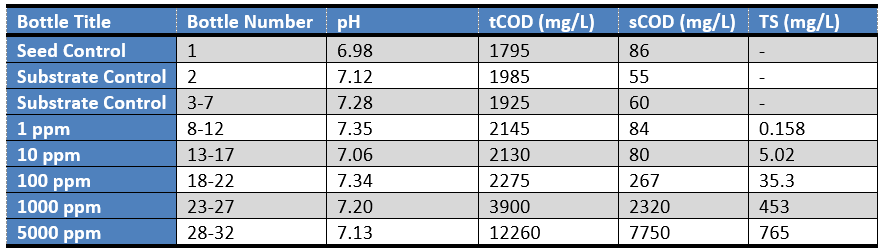
Final data following the respirometer study is shown in Table 2. sCOD data shows that the bottles below 100 ppm Test Substance removed most of the sCOD in the bottles, while the bottles with 100 ppm and above of Test Substance did not remove most of the sCOD in the bottles. Chemical constituent testing shows that between 49.8% and 84.7% of the Test Substance was removed from each bottle, indicating that biological treatment of the test substance is possible.
Conclusion
Based on respirometric data along with initial and final physicochemical testing, the test substance is inhibitory to this POTW biomass and high concentrations of it could lead to problems for the POTW. The inhibition caused by doses 1, 10, and 100 ppm was brief and did not lead to notable differences in cumulative oxygen uptake, while the inhibition caused by doses 1,000 and 5,000 ppm caused severe prolonged inhibition. There is some evidence that acclimation to the test substance is possible for the biomass, but acclimation testing was outside of the scope of this study, and more testing would be necessary to confirm this.